Mining Your Gmail Data - Part 5
/Last time I talked about mining my Gmail data, I figured out that most of my received attachments (by size) were from friends and family. This time I'm going to break down the data a little more so I can figure out what types of data are in those attachments. On a practical level, I could reduce my Gmail backup size by deleting old messages with photos I already have backed up elsewhere. In reality, I just want to screw around with the charting capabilities in pandas.
This time I need all the data broken down by individual attachments. The script for this is similar to the last one, but instead of aggregating the attachments per message, I'm keeping them separate. I'm also grabbing some additional data, like the MIME type of each attachment and the file name. And because I'll need counts of individual attachments, I need to make sure I've got a unique ID for them. I can't use the message ID, because a single message can have multiple attachments. And I can't use the file name, because that may be repeated across messages. So I'm concatenating the two into a new field called AttachmentId. I'm also ignoring all the emails without any attachments. Here's the new script:
$emails = @()
$gmvaultdb = "C:\Users\hartez\gmvault-db\db"
$total = (Get-ChildItem $gmvaultdb -Recurse -Filter *.eml | measure).Count
Add-Type -Path "MimeKit.1.2.10.0\lib\net45\MimeKit.dll"

Get-ChildItem $gmvaultdb -Recurse -Filter *.eml | ForEach-Object {$i=0} {
    Write-Host "Processing $_ ($i of $total)"
    $mimeMessage = [MimeKit.MimeMessage]::Load($_.FullName)
    $attachments = @()

    $mimeMessage.Attachments | % {
        $attachment = @{
            Id = $mimeMessage.MessageId + $_.ContentDisposition.FileName
            FileName = $_.ContentDisposition.FileName
            ContentTypeName = $_.ContentType.Name
            MimeType = $_.ContentType.MimeType
            MediaType = $_.ContentType.MediaType
            MediaSubtype = $_.ContentType.MediaSubtype
            Length = $_.ContentObject.Stream.Length
            ContentType = $_.ContentType
        }
        $attachments += (New-Object PSObject -Property $attachment)
    }

    $mimeMessage.From.ToString() -match '"\s<(.*)>$' | Out-Null;
    $fromEmail = $Matches[1]

    if($attachments.Count -gt 0) {
        $attachments | % {
            $props = @{
                Id = $mimeMessage.MessageId
                To = $mimeMessage.To.ToString()
                From = $mimeMessage.From.ToString()
                FromEmail = $fromEmail
                AttachmentId = $_.Id
                FileName = $_.FileName
                ContentTypeName = $_.ContentTypeName
                MimeType = $_.MimeType
                MediaType = $_.MediaType
                MediaSubtype = $_.MediaSubtype
                Size = $_.Length
                ContentType = $_.ContentType
            }
        }

        $emails += (New-Object PSObject -Property $props)
    }

    $i++
}

$emails | Select Id, To, From, FromEmail, FileName, AttachmentId, ContentTypeName, MimeType, MediaType, MediaSubtype, Size, ContentType | Export-Csv attachments2.csv -NoTypeInformation
In pandas, I'm doing the usual import of the data and filtering down to messages which aren't from myself. Then I group the data by MIME type:
types = notFromMe.groupby(['MimeType'])
and create aggregate columns for the total number of attachments of each type and the total size of those attachments:
types = types.agg({'AttachmentId' : 'count', 'Size' : 'sum'})
I'll also need the total number of attachments and the total size of all attachments so I can calculate percentages:
    totalCount = types['AttachmentId'].sum()
    totalSize = types['Size'].sum()
With that in place, adding the percentage columns is easy:
    types['percentCount'] = types['AttachmentId'] / totalCount
    types['percentSize'] = types['Size'] / totalSize
At the top of the script I've already imported matplotlib:
    import matplotlib.pyplot as plt
    plt.style.use('ggplot')
Now we're all set to plot this data so I can see the relative sizes of each file type. I'll start with 'percentSize':
    types['percentSize'].plot(kind='pie', figsize=(6, 6))
    plt.show()
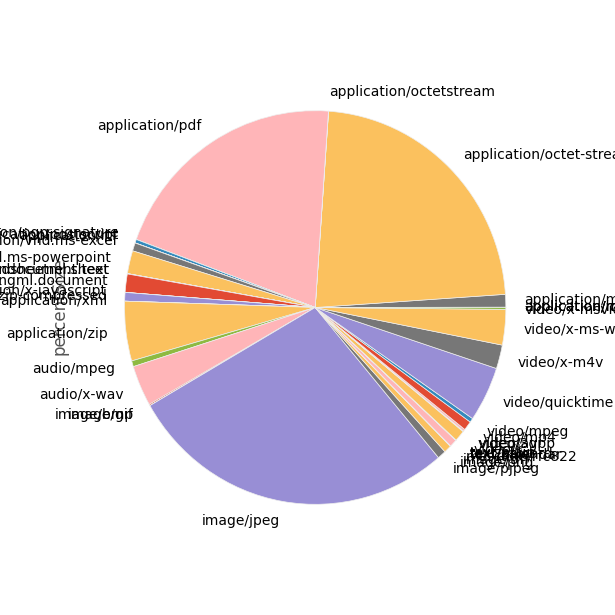
Wow. That's ... pretty ugly. Let's see if we can un-clutter that a bit by combining all of the really low-percentage stuff into a slice called "other". While we're at it, we'll create a method that we can re-use when we want to graph the percentages by count:
    def combinedPlot(df, col, cutoff):

        # Just get the mime types which are 1% or more
        overCutoff = df[col]
        overCutoff = df.query(col + '>' + str(cutoff))

        # Fill in the 'other' section
        remaining = 1 - (major[col].sum())
        other = pd.DataFrame({col : pd.Series([remaining], index = ['other'])})

        # Add the 'other' section to our main data
        both = overCutoff.append(other)

        # Plot it
        both[col].plot(kind='pie', figsize=(6, 6))
        plt.show()
To use it, we just drop in our types data frame, the column we want to graph, and where we want to cut off the data:
combinedPlot(types, 'percentSize', 0.01)
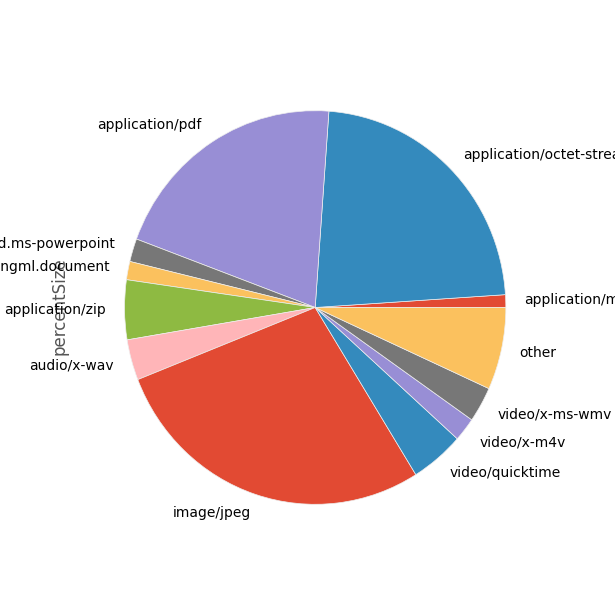
That's much better. But it raises a couple of questions:
- What's with application/octet-stream? That could be any sort of file; can we dig down into that?
- Can we get some more succinct labels? We don't really need the 'application/; and 'video/' prefixes.
This is already long; we'll get to those questions next time.